The development of Mapysto
by Jean-Sebastien Coron|
Mapysto was developped over the last 20 years by Jacques Patarin;
he has developed the maps, the texts, the numerical datas, and a non-commercial version in Borland Turbo Pascal under DOS.
Below I describe the development of the iPhone/iPad application. For the iOS application, I did not translate the Pascal files into Objective C; rather I compiled and ran the Pascal files with slight modifications to output the maps and other relevant informations. Then some post-processing is done on the maps, essentially under Python. The post-processed maps are eventually used by the iOS application, built under Objective C. Some routines from the post-processing layer are available on Github. 1. The Pascal layerThe following features have been developped by Jacques Patarin in Turbo Pascal under DOS (only a subset is currently included in the iOS application):
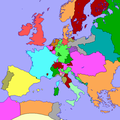
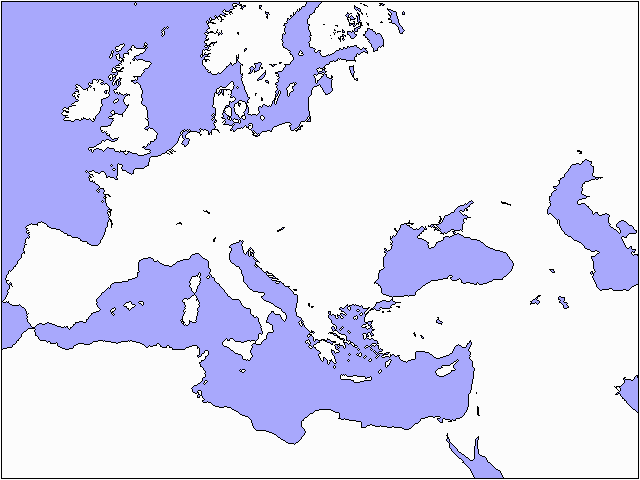
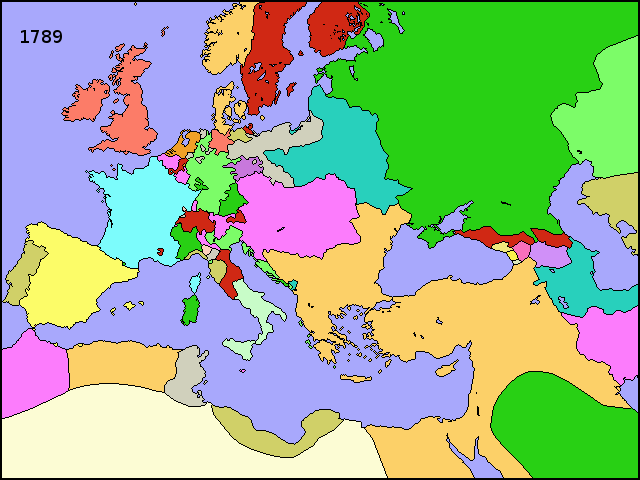
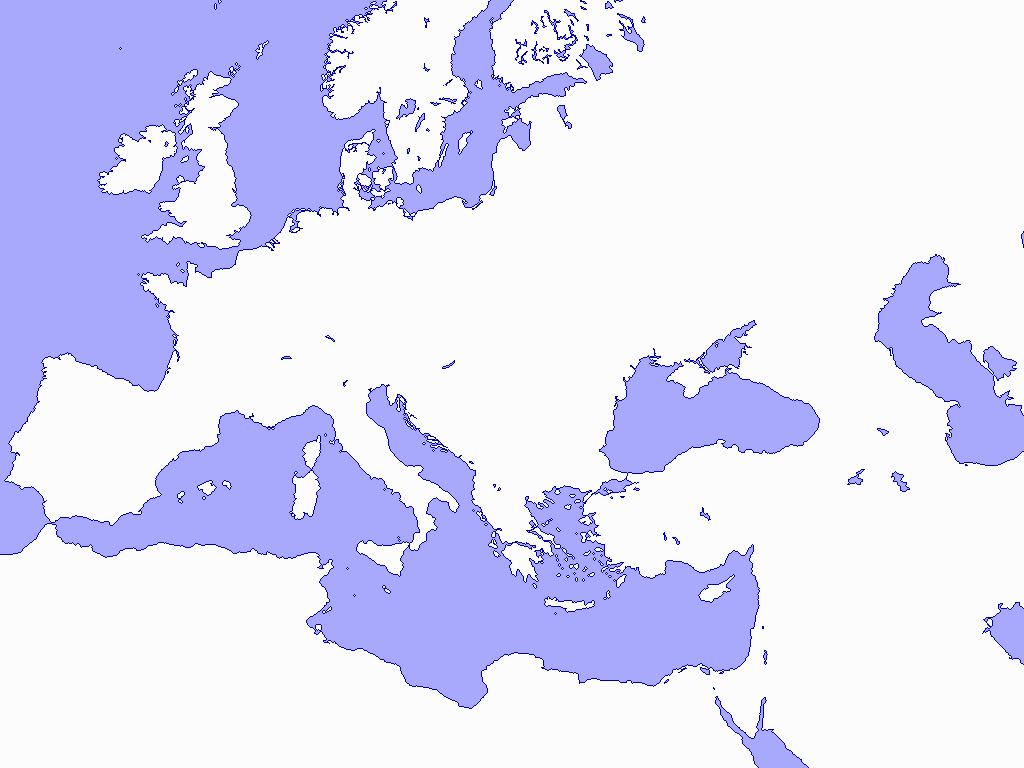
2. The post-processing layerThe post-processing layer consists in increasing the resolution of the maps, compressing the set of maps, and determining the position of the state and city names in the final maps. This layer is written essentially in Python.Increasing the resolutionSince the initial Mapysto development was under DOS, the maps have 640*480 resolution, which is not enough for the iOS application in which zooming is allowed. Therefore the maps are first converted into the 1024*768 format.For this a blank map of Europe is again used, this time in 1024*768 format. Then the frontiers are again drawn as polylines, by extrapolating the polylines from the 640*480 format. However one cannot paint the various states directly; namely due to unavoidable rounding errors in the drawing of the polylines on the new 1024*768 format, there exists many pixel discripancies and therefore not all areas are closed. Therefore a different algorithm is used, which is essentially based on a comparison with the (correctly painted) map in 640*480 format, to obtain a colored map in 1024*768 format. Compression of the mapsFor the iOS application, one possibility could be to start with a blank map in 1024*768 format, draw the frontiers with polylines, and eventually paint the states. However this is too slow, so we prefered to store the maps in PNG format, since reading PNGs on iOS is very fast.However in 1024*768 format, every map takes rougly 25 kB. So with roughly 5000 maps, the iPhone application would take 125 MB, which is too much. Since the maps change only incrementally, one possibility could be to store only the diff between successive maps. Concretely one could compute the xor between two successive maps; the xored map would be stored in PNG format; that would not take too much space since most of the xored map would be 0; then to recompute a map one would first load the initial map, and the xored map, and compute the xor. However this is still too slow. Instead we used the following trick. All maps are stored in palette format, where every pixel is stored in a single byte which is an index in a palette of 256 colors. Then to incrementally change a map we simply modify the palette without changing the byte map itself. Then reading a new map essentially amounts to loading a PNG (with a modified palette), which is very fast on iOS. Using this technique we achieve a compression ratio of roughly 100, so the 5000 maps require only roughly 1 MB. State and City namesEventually we put the state and city names on the map, without collisions. We define two levels of zooming. In the first level, we put the names of the main states, and their capitals. In the second level, we try to put all the names of the states and the names of the main cities. Those names will be written on the map by the iOS application (instead of writing the names inside the PNG, which would not produce a good result when zooming).3. The iOS applicationThe iOS application outputs the maps from the post-processing layer. This layer is written in Objective C, with some parts in C. One gets the colored map with the names, and the description of the corresponding event (in french, but we are working on an english translation).Lines of codeHere is the line count using cloc:
    -------------------------------------------------------------------------------
    Language                     files          blank        comment           code
    -------------------------------------------------------------------------------
    Pascal                         600          72312          59766         172291
    Python                          74           1174            269           5205
    C                               17            331            120           1664
    Objective C                     19            488            275           1415
    -------------------------------------------------------------------------------
    SUM:                           710          74305          60430         180575
    -------------------------------------------------------------------------------
We see that the post-processing layer and the iOS application layer are tiny compared to the Pascal layer.
|